| Graphics Programming in Processing - Lesson 1 Drawing Flags - Dave Mulkey, Germany 2012 |
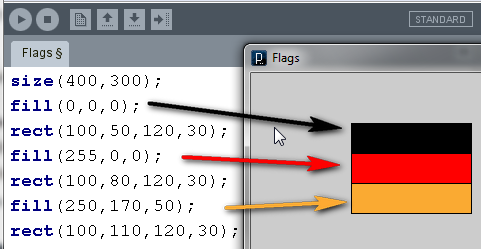
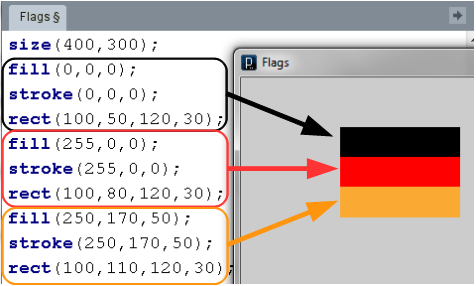
| BLACK 0,0,0 |
WHITE 255,255,255 |
RED 255,0,0 |
GREEN 0,255,0 |
BLUE 0,0,255 |
PURPLE 255,0,255 |
Austria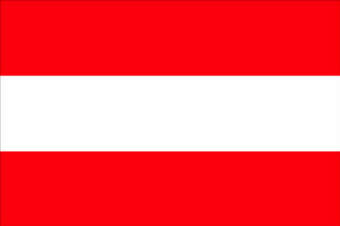 Sweden |
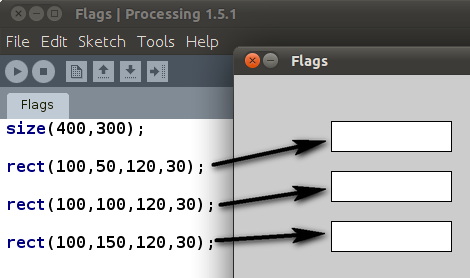
Belgium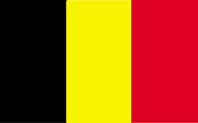 Germany |
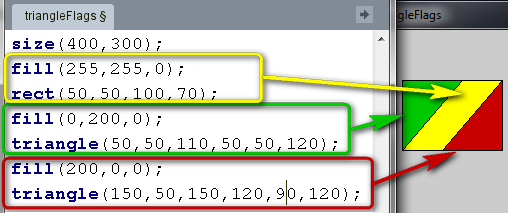
| Congo |
Scotland |
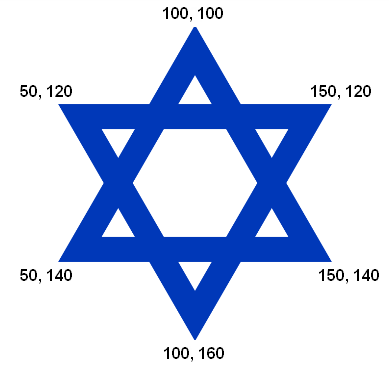
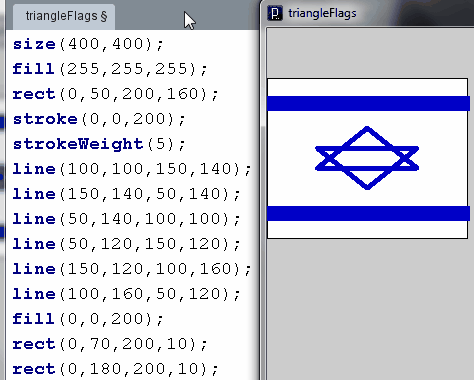
Israel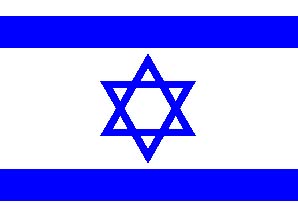 |