//-------------------------------------------------------------------
//
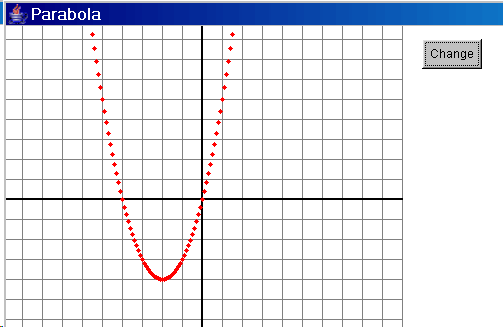
This program draws a mathematical graph by plotting single points.
// A continuous
"curve" could be drawn by drawing lots of small
// line segments
(connecting the dots).
//-------------------------------------------------------------------
import java.awt.*;
public class Parabola extends EasyApp
{
public static void main(String[] args)
{ new Parabola(); }
Button bAdd = addButton("Change",420,40,60,30,this);
double A = 1;
double B = 0;
double C = 0;
public Parabola()
{ setTitle("MathDraw");
this.setSize(630,450);
repaint();
}
public void actions(Object source,String command)
{
if (source == bAdd)
{ A = inputDouble("A");
B = inputDouble("B");
C = inputDouble("C");
}
repaint();
}
public void paint(Graphics g)
{
grid(g);
curve(g);
}
public void grid(Graphics g)
{
g.setColor(Color.gray);
for (int x = 0; x <=400; x = x + 20)
{
g.drawLine(x,0,x,400);
}
for (int y = 0; y <=400; y = y + 20)
{
g.drawLine(0,y,400,y);
}
g.setColor(Color.black);
g.drawLine(200,0,200,400);
g.drawLine(199,0,199,400);
g.drawLine(0,199,400,199);
g.drawLine(0,200,400,200);
}
public void curve(Graphics g)
{
g.setColor(Color.red);
for (double x=-10;x<=10;x = x+0.1)
{
double y = A*x*x+B*x+C;
int xp = (int)Math.round(200 + x*20);
int yp = (int)Math.round(200 - y*20);
g.fillOval(xp-2,yp-2,5,5);
}
}
}